Graph Information
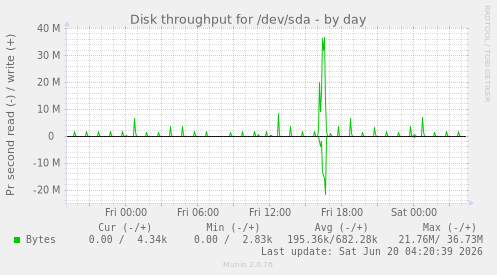
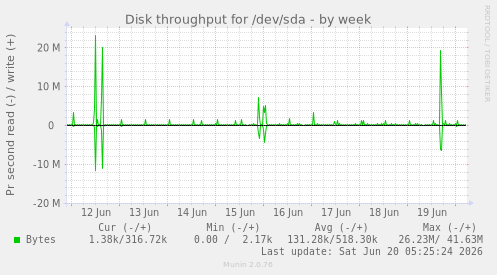
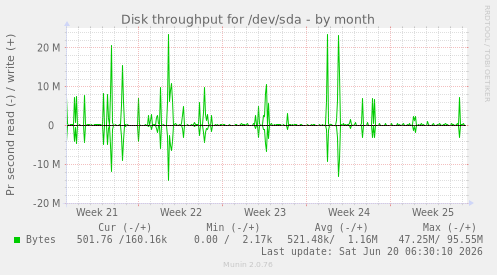
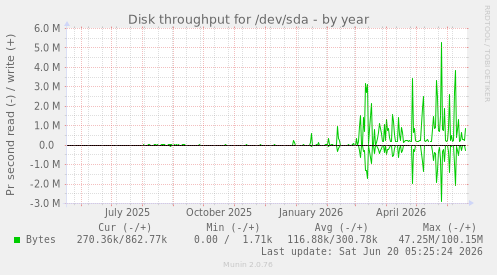
This graph shows disk throughput in bytes pr ${graph_period}. The graph base is 1024 so KB is for Kibi bytes and so on.
| Field | Internal name | Type | Warn | Crit | Info |
|---|---|---|---|---|---|
| Bytes | wrbytes | gauge |
This graph shows disk throughput in bytes pr ${graph_period}. The graph base is 1024 so KB is for Kibi bytes and so on.
| Field | Internal name | Type | Warn | Crit | Info |
|---|---|---|---|---|---|
| Bytes | wrbytes | gauge |