Graph Information
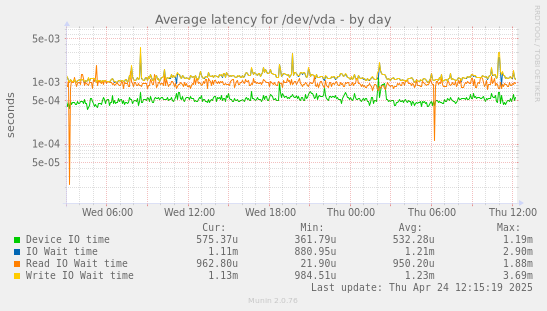
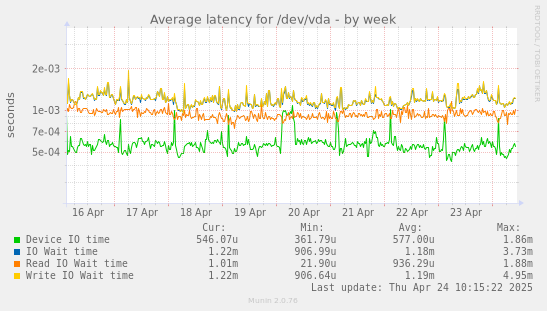
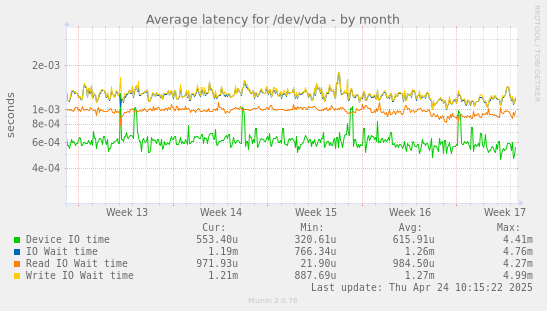
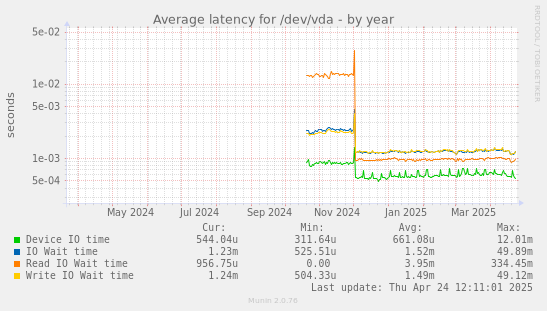
This graph shows average waiting time/latency for different categories of disk operations. The times that include the queue times indicate how busy your system is. If the waiting time hits 1 second then your I/O system is 100% busy.
| Field | Internal name | Type | Warn | Crit | Info |
|---|---|---|---|---|---|
| Device IO time | svctm | gauge | Average time an I/O takes on the block device not including any queue times, just the round trip time for the disk request. | ||
| IO Wait time | avgwait | gauge | Average wait time for an I/O from request start to finish (includes queue times et al) | ||
| Read IO Wait time | avgrdwait | gauge | 0:3 | Average wait time for a read I/O from request start to finish (includes queue times et al) | |
| Write IO Wait time | avgwrwait | gauge | 0:3 | Average wait time for a write I/O from request start to finish (includes queue times et al) |